| | |
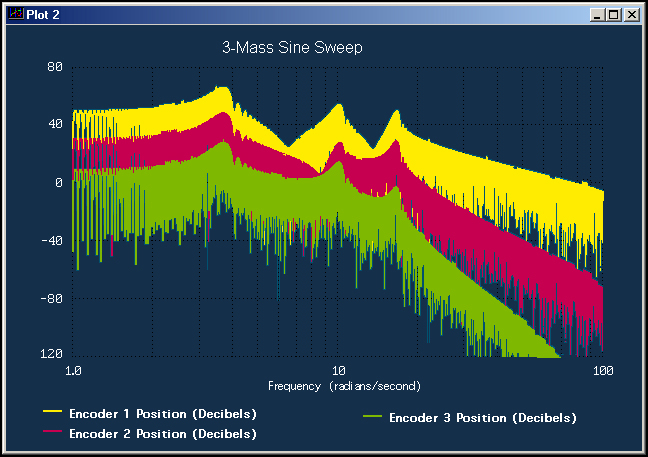
Setup Plot: Up to 24 acquired or software derived variables may be selected for plotting. A variety of linear and logarithmic plotting formats are available to give both time and frequency domain presentations of sine sweep data. Plot Data: Data is plotted per setup format. Plot function provides multiple plots, tiling, resizing, and shrink-to-icon features. Axis Scaling: Allows user to zoom plots to magnify regions of interest. Provides options for identifying acquired data points on plot. Print Plot: Prints plot to any common printer type. Real-time Plotting: Provides oscilloscope-like display of acquired data in real-time. This is particularly useful in helping students correlate physical behavior with plotted data. It is also useful in observing non-visible system states such as the response of control effort to manually imposed disturbances. Save / Load Plot Data: Saves all acquired data in a form for later retrieval and viewing. (Data may also be exported to other applications via the Data Menu and all working parameters may be saved via the File Menu.)
Go to Example LQR Experiment (70K) to view additional data plots or to Experiments Page for a variety of experiments and associated plots. | |